Stock Market Drops. Will Correction Continues?
The US broad-market index, S&P 500, has been pressed below the 50-day moving average for the first time since March! Why?
- Investors are waiting for the Federal Reserve to hold a meeting on Wednesday. The central bank isn’t likely to take some hawkish actions, but it may hint at tapering this year. This will be good news for the US dollar and negative for the stock market. The anticipation of this decision is already setting the market in motion.
- The overall sentiment is pressing not only the US stock indices but also the Hang Seng index and an Australian one. Besides, most of the risk-on assets are losing their value while the US dollar is getting stronger.
- Quadruple witching is adding to the increased volatility as well. It is the simultaneous expiration of four kinds of options and futures contracts.
Tech outlook
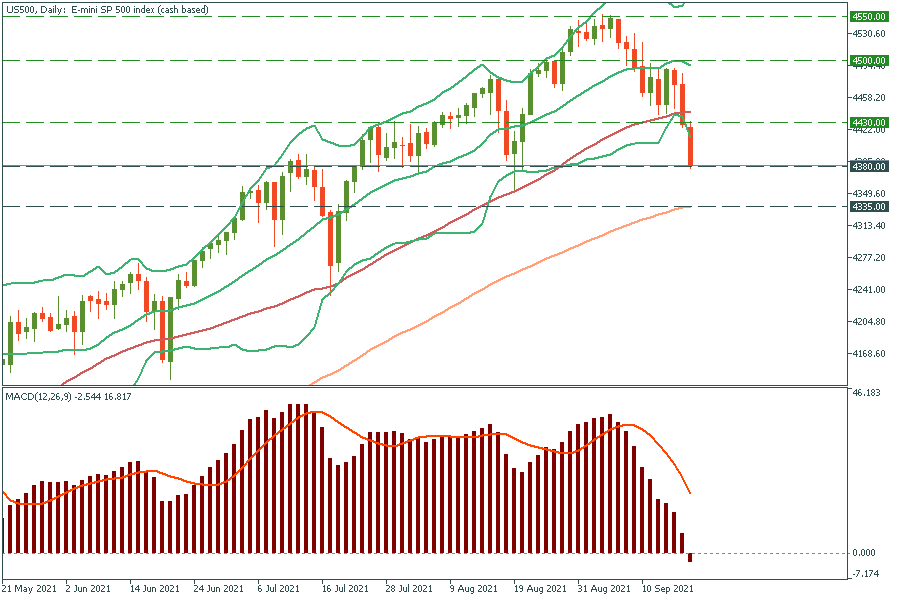
The S&P 500 index (US500) has dropped below the lower line of Bollinger Bands, which means that the price is at extreme lows and it’s going to reverse up soon. However, the correction may continue if the index breaks below the support line of 4380. The stock index may reach the 100-day moving average of 4335.
Not to miss the reversal, we highly recommend you add the MACD indicator to your chart and monitor the breakout above the zero line. When it occurs, it would signal the upcoming reversal up.
Resistance levels are the 50-day moving average of 4430 and the middle line of Bollinger Bands at 4500.
Read more on our TradingView.