US100: Consolidated and preparing correction below 18100. Key levels on H4!

US100: Consolidated and preparing correction below 18100. Key levels on H4!

2024-03-14 • Updated

  • Bearish Scenario: Shorts below 18100 with TP1: 17900, TP2: 17814, and 17630 with S.L. above 18130 or at least 1% of account capital*.

  • Anticipated Bullish Scenario: Intraday longs above 18130 with TP: 18219, TP2: 18270, and TP3: 18428, with S.L. below 18050 or at least 1% of account capital*. Apply trailing stop.

Bullish Scenario after Retracement: (After breaking support at 17813.95) Intraday longs above 17630 with TP: 17813, TP2: 17900, and TP3: 18000, with S.L. below 17600 or at least 1% of account capital*. Apply trailing stop.

H4 Scenarios:

After last week's historic high reached 18428.60, a sales POC formed around 18273.29, an area that was the target of the recent rally and efficiently defended by the bears.

The decline has left three uncovered POCs at 18273.29, 18219.90, and today's Thursday at 18128.45, forming a block of sales, which for now will keep prices under pressure to seek supports at 17901.50 and 17813.95, especially after decisively breaking the buying zone around 17985.43.

The breaking of the indicated supports will initiate a more extended corrective phase, with the next target being the buying zone around 17629, whose breaking on a second touch will extend the decline towards 17452. Note that US100 prices tend not to reach zones exactly but to approach within a few pips.

The bullish continuation can be renewed from the buying zones observed in the H4 chart and after the decisive breaking of the sales above zones, which will allow the price to challenge the resistances at 18265 and 18428, in an attempt to create new all-time highs.

 For now, the price challenges the buying zone between 17984 and 17960, whose bullish reaction was limited to the day (D1:O) and week (W1:O) openings, indicating that as long as prices remain below the openings, it is more likely to extend sales to seek liquidity further down in the following buying zones marked on the chart with orange lines and levels.

*Uncovered POC: POC = Point of Control: It is the level or zone where the highest volume concentration occurred. If there was a bearish movement from it previously, it is considered a sales zone and forms a resistance zone. On the contrary, if there was previously a bullish impulse, it is considered a buying zone, usually located at lows, forming support zones.

Nasdaq 100.png

**Consider this risk management suggestion

**It is essential that risk management is based on capital and traded volume. For this, a maximum risk of 1% of capital is recommended. It is suggested to use risk management indicators such as Easy Order.

Disclaimer

This document is not a recommendation to buy or sell financial products and should not be considered a solicitation or offer to engage in transactions. This document is economic research by the author and does not intend to provide investment advice on securities or other investment transactions at FBS. Although every investment involves some risk, the risk of loss in trading forex and other leveraged assets can be significant. Therefore, if you are considering trading in this market, you should be aware of the risks associated with this product to make informed decisions before investing. The material presented here should not be interpreted as advice or trading strategy. All prices mentioned in this report are for informational purposes only.


Similar

US100: Has the correction ended?

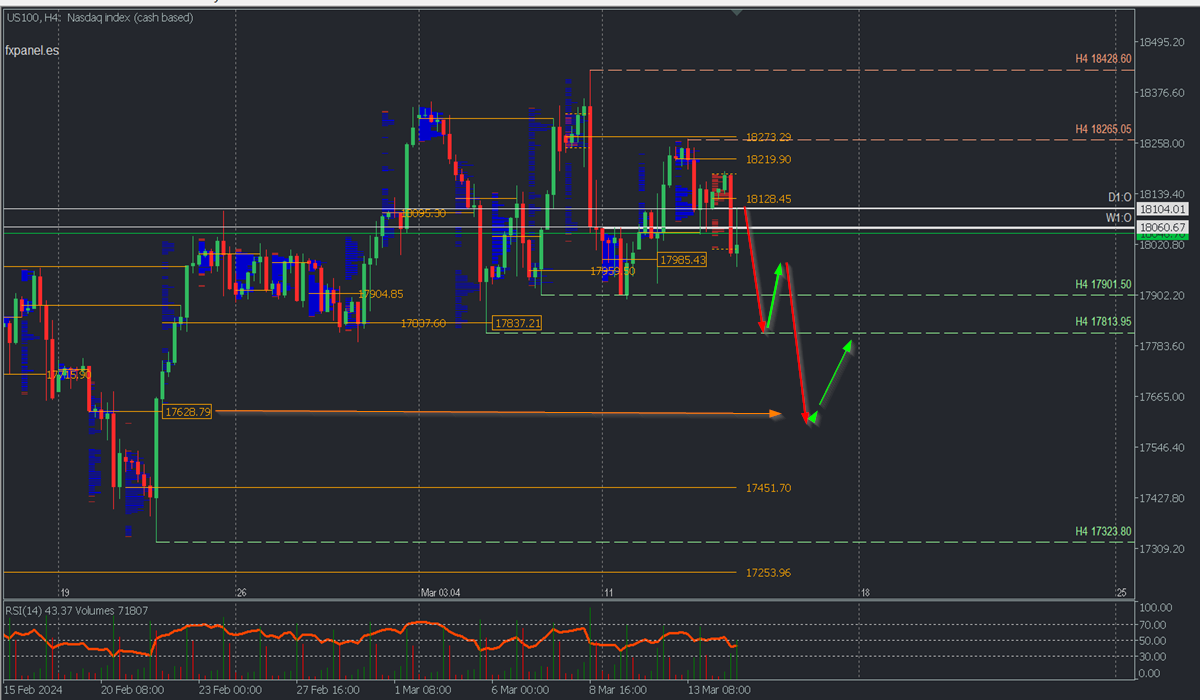
Bullish Scenario: Buys above 17910 with TP:18098.07, TP2:18277, and TP3: 18415 Bearish Scenario: Sells below 17850 with TP1:17730, TP2: 17700

Latest news

USD: Powell Speaks on Cutting Interest Rates

Jerome H. Powell, the Federal Reserve chair, stated that the central bank can afford to be patient in deciding when to cut interest rates, citing easing inflation and stable economic growth. Powell emphasized the Fed's independence from political influences, particularly relevant as the election season nears. The Fed had raised interest rates to 5.3 ...

WTT: Currency Pairs To Trade In April

Hello again my friends, it’s time for another episode of “What to Trade,” this time, for the month of April. As usual, I present to you some of my most anticipated trade ideas for the month of April, according to my technical analysis style. I therefore encourage you to do your due diligence, as always, and manage your risks appropriately.

Deposit with your local payment systems

Data collection notice

FBS maintains a record of your data to run this website. By pressing the “Accept” button, you agree to our Privacy policy.

Callback

A manager will call you shortly.

Change number

Your request is accepted.

A manager will call you shortly.

Next callback request for this phone number
will be available in

If you have an urgent issue please contact us via
Live chat

Internal error. Please try again later

Don’t waste your time – keep track of how NFP affects the US dollar and profit!

You are using an older version of your browser.

Update it to the latest version or try another one for a safer, more comfortable and productive trading experience.

Safari Chrome Firefox Opera